
San Diego Rain Patterns 2025-2026 Captured from Elfin Forest
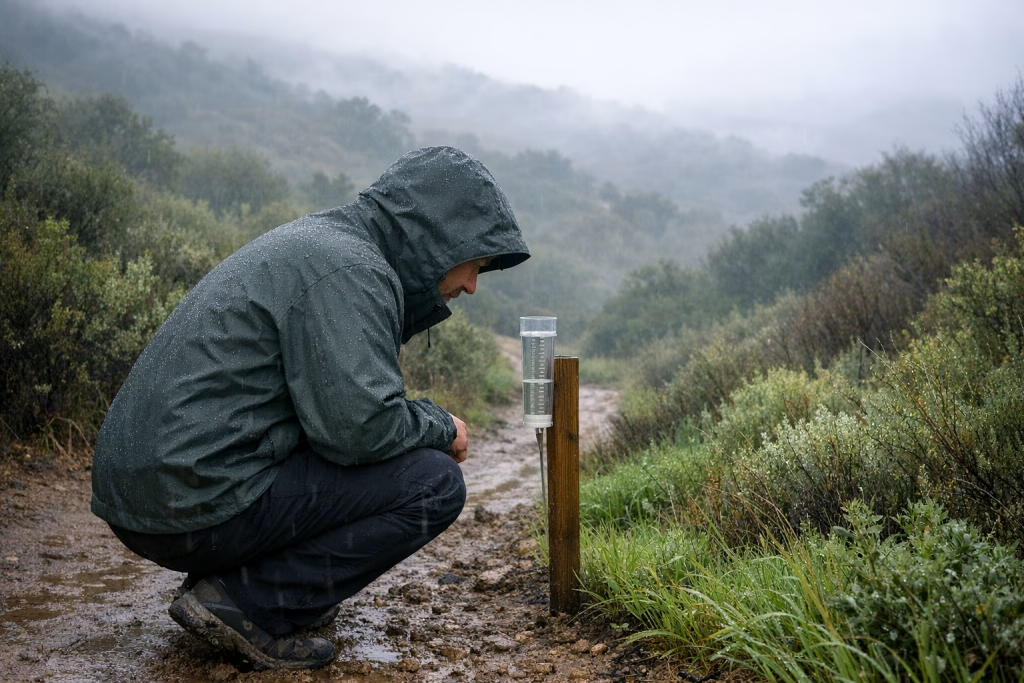
I’ve kept a rain gauge in Elfin Forest for a good while now—up at roughly 777 feet between Encinitas and Escondido—and I’ve grown a bit attached to the quiet routine of checking it. You step outside, you look at the meniscus, you note the time, and suddenly the bigger “San Diego weather story” feels less like headlines and more like something you can actually hold in your hands.
This post shares what I recorded across late 2025 and early 2026, then puts those notes next to publicly available National Weather Service (NWS) observations for nearby places such as Oceanside, Carlsbad, and Julian. If you live or work in North County, run a property, manage field sales, or you simply plan weekends like a sensible person, these patterns help you predict what the next storm might do at your elevation, not just “San Diego” in the abstract.
And yes—because I work with marketing teams that like real signals (not vibes), I’ll also show you how I’d turn a simple “rain diary” into useful automation: alerts, lead scoring triggers, campaign timing, and ops checklists using make.com or n8n. It’s not glamorous, but it’s the sort of thing that saves you time and prevents the Monday-morning scramble.
What makes Elfin Forest a useful “microclimate” checkpoint
San Diego County rewards anyone who respects microclimates. In one hour you can drive from the coast to foothills and feel like you’ve travelled through a few seasons. In my notes, rainfall changes with:
- Elevation (foothills often collect more than the immediate coast)
- Storm track (bands can stall in one pocket and miss another by a mile or two)
- Wind (gusty fronts can push rain sideways and skew what you “feel” vs what falls)
- Orographic lift (the inland rise encourages extra rain—Julian frequently stands out)
That last point matters. Whenever I compare my gauge with nearby NWS site summaries, a consistent theme shows up: Julian runs wetter, the coast runs lighter, and the mid-elevation foothills (where I sit) swing either way depending on how the bands set up.
How I captured the data (and how you can replicate it)
I kept this simple. No fancy station that needs a firmware update at the worst moment.
- Manual rain gauge readings after notable showers or storm periods
- Time-stamped notes on intensity (drizzle vs heavier bursts), fog, and wind
- Comparisons against NWS-reported totals for nearby communities when available
If you want to copy this at home, you can. Put the gauge away from roof drip-lines and sprinklers, keep it level, and write down readings at consistent times. Your future self will thank you—especially when someone insists “it hardly rained” and you can politely (and accurately) disagree.
January 2026: a wet start that didn’t wait for permission
January kicked off in a way that felt like the sky trying to make up for lost time. Forecasts didn’t always match what I saw in the gauge, which is exactly why local measurements help.
1 January: light showers, steady accumulation
On 1 January, light, passing showers added 0.07 inches. That pushed the storm total to 1.87 inches. Nothing dramatic—just persistent, slightly annoying “wet jacket” weather.
3 January: fog and a little bit of everything
On 3 January, fog hung around and light showers added 0.05 inches. The sky brightened later, the way it often does here: grey morning, reluctant sun, then a false sense of security.
4 January: a modest day that hid a sharper burst
4 January brought very light afternoon rain with a brief heavier drop. I noted 0.10 inches by evening and 0.20 inches overnight. I later corrected the month’s running number (a tidy little reminder that humans, not robots, take these readings). The month sat around 1.82 inches in my notes at that point.
5 January: the gauge tells a different story than the forecast
On 5 January, the night produced 0.49 inches. Over two days I had 0.59 inches total. The NWS outlook didn’t quite keep pace with what fell locally, and I’ve seen that pattern before: bands sit over foothills, while the broader forecast paints the region with one brush.
February 2026: three storms, plenty of wind, and a proper winter feel
February felt like a mini-series: three storms, not much downtime, and wind that made everything sound more dramatic than it really was. If you manage crews outdoors, you’ll recognise this month as the one where plans get rewritten with coffee in hand.
Storm 1 (16 February): light rain, then a front with punch
On 16 February, light rain started around late morning. A front moved through around 2 p.m., and I recorded wind gusts up to 46 mph. I didn’t pin down a clean storm total in the note itself, but the overall “feel” was clear: the wind mattered as much as the rain.
Storm 2 (18 February): bigger gusts, clear totals, and stronger inland numbers
The second storm landed on 18 February with gusts that reached 54 mph early in the morning. My gauge showed 0.44 inches for that event, and the two-storm total reached 1.89 inches in my running notes.
What stood out most was the inland contrast. Local numbers I referenced for the broader area included:
- Poway: 2.08 inches (about +0.59 compared with my two-storm figure)
- Ramona: 2.61 inches (about +0.73)
- Julian: 4.78 inches (about +1.62)
In the mountains farther east, I noted reports of 2–3 feet of snow in the San Bernardino area during that broader period. That’s a classic Southern California contrast: you can be measuring rain in the foothills while someone else digs out a driveway in the mountains.
Storm 3 (20 February): “supposed to be lighter”, still delivered
On 20 February, the third storm added 0.59 inches, with a recorded gust around 36 mph. My notes put the three-storm total at 2.48 inches. Forecasts suggested the third would be lighter, but it still did the job. If you’ve lived here long enough, you know that “lighter” can still mean soggy shoes.
December 2025: sharp bands, heavier bursts, and big regional spread
December is often when people in San Diego start saying, “We really needed this,” and then, hours later, complain about traffic as if rain is a personal insult. My notes show a couple of storm moments with strong contrasts.
24 December: bands and heavier bursts
On 24 December, bands of rain moved in during the afternoon with heavier bursts. I logged a total of 0.65 inches. I also noted much higher totals reported in other parts of Southern California—up to 10 inches in some areas around Los Angeles and mountains.
27 December: a smaller follow-up
On 27 December, I recorded 0.29 inches across “last night and yesterday.” I didn’t have an easy NWS comparison in the note, but the event read as the kind of follow-up system that keeps soil damp without causing much fuss.
November 2025: changeable storms that sometimes missed their mark
November behaved like November often does: a mix of heavier rain windows and near-misses where the forecast looks bold and your driveway stays mostly dry.
15–16 November: a heavy stretch, then lingering showers
On 15 November, I logged 1.38 inches by 4 p.m., then a lighter drizzle later. That same morning I had only 0.48 inches because earlier storms had skirted the area. By 16 November, overnight showers pushed the running total to 1.54 inches.
18–23 November: smaller additions and a forecast overshoot
On 18 November, rain from the evening added 0.66 inches plus 0.07 inches later, totalling 0.73 inches. On 20 November, a third storm contributed 0.12 inches by evening. On 23 November, I added 0.02 inches for a 0.46-inch storm total in that window—less than a 1 inch coastal prediction I referenced at the time.
This is where local measurement beats general expectation. You can plan around a forecast, sure, but you should verify after the fact if you make operational decisions (staffing, inventory moves, site visits) based on “it should rain about an inch.” Sometimes it simply doesn’t.
Earlier 2025 snapshots: drizzles, dry spells, and oddly placed rain
My notes also include earlier bits from 2025 that help explain the bigger rhythm: long dry stretches punctuated by quick, localised storms.
March 2025: a “rain spot” event and under-delivery
On 7 March 2025, I noted a storm total of 1.53 inches that behaved like a strange patch of rain rather than a clean front. Then, on 11 March, I recorded 0.44 inches despite larger expectations. On 12 March, another 0.02 inches arrived overnight, bringing that small sequence to 0.46 inches.
April 2025: a small, tidy shower day
On 26 April 2025, I logged 0.08 inches from overnight and afternoon showers. It barely registers emotionally, but it matters for vegetation and soil moisture—especially after drier weeks.
September 2025: interior storms, modest totals
In September 2025, storms leaned inland. I noted Ramona at 0.30 inches and Julian at 0.03 inches in that brief snapshot. It’s a reminder that even “wetter places” don’t always win; storm placement calls the shots.
February 2025: minimal rain despite the calendar saying “winter”
On 6 February 2025, I recorded only 0.02 inches. On 12 February, a light storm added 0.13 inches, again with forecasts hinting at more than what arrived.
Wind: the recurring character in these notes
I can’t talk about these storms without talking about wind. I kept returning to gusts in my notes because they affect:
- Perceived intensity (wind makes modest rain feel rougher)
- Driving conditions (debris, crosswinds, slick roads)
- Outdoor work (ladders, signage, tents, and “quick jobs” that suddenly aren’t)
- Rain distribution (gusts can shift bands and throw rain sideways)
The notable gusts I recorded included 54 mph (18 February 2026) and 46 mph (16 February 2026). Even when rainfall totals look modest on paper, those gusts change the day.
What these rain patterns mean if you live in North County (practical takeaways)
If you want a simple, usable summary, here’s what I’d tell you over a cuppa:
- Expect uneven totals across short distances. Your friend near the coast can stay almost dry while you’re emptying the gauge inland.
- Julian often runs wetter in multi-storm sequences, and it shows up clearly in comparative totals.
- Forecasts can miss local “banding”, especially when storms arrive in waves and the heaviest segments stall or drift.
- Wind matters operationally. It affects safety and scheduling as much as rainfall totals do.
For me, the biggest lesson is consistency: when I measure the same way over time, I stop arguing with single-day impressions and start seeing the county’s patterns as they really behave.
SEO notes: common search intents this post addresses
I’m writing this in a way that matches how people actually search when they’re trying to plan, compare, or explain weather locally. In practice, readers tend to look for:
- San Diego rain patterns 2025 2026
- Elfin Forest rainfall totals
- North County San Diego rain gauge
- San Diego microclimates rain
- Julian vs coastal rainfall
- San Diego storm totals February 2026
If you run a local business, this matters because people also search around service timing: “roof leak after storm,” “landscape drainage,” “mould inspection,” “gutter cleaning,” and so on. Weather content pulls in those visitors when it’s grounded in real local detail.
Turning weather notes into business actions (make.com and n8n ideas)
This is where my day job pokes through. I build automations for marketing and sales teams, and I’ve learned that “small, reliable signals” beat big dashboards that nobody checks. Your rain log can become a signal.
1) Storm-triggered lead follow-ups for local services
If you operate in home services (roofing, drainage, tree care, water damage restoration), you can trigger outreach when conditions suggest demand will rise.
- When local rainfall in your area crosses a threshold (say 0.50 inches in 24 hours), create a task for your sales team.
- Send a short, polite email to past customers: “If you spotted leaks or pooling, I can book an inspection this week.”
- Assign leads by territory (coast vs foothills vs inland) since rain varies by location.
I’ve seen this work best when the message stays helpful and specific. Nobody wants panic marketing. People do appreciate a timely reminder, though—especially when their gutters are clogged and they’ve been meaning to sort it out since, well, last winter.
2) Ops checklists for windy fronts
Those 46–54 mph gusts are not trivia. If you run outdoor crews, you can automate a “wind-front checklist”:
- Pull a wind advisory feed or forecast for your service area.
- If gusts exceed your internal threshold, ping your team in Slack/Teams.
- Create a checklist item: secure signage, reschedule ladder work, pre-stage debris bags.
In make.com or n8n, this is straightforward: a scheduled workflow checks a data source, then branches based on thresholds. I like keeping the message short, because long alerts get ignored.
3) Geo-segmented campaigns that respect microclimates
Many local businesses blast the same message across all of San Diego County. Your customers experience different weather, so those messages can feel out of tune.
- Segment your list by zip code and rough elevation bands (coastal vs inland).
- When a storm mainly hits inland, prioritise inland segments for relevant offers.
- When the coast stays light, avoid overhyping “storm recovery” messaging there.
I’ve written and tested campaigns like this. They tend to get fewer eye-roll replies and more bookings, which is the whole point.
4) Content automation: “storm recaps” that write themselves (carefully)
You can also produce local content faster—without turning your blog into AI soup.
- Store daily readings in a Google Sheet or Airtable.
- After a storm window, generate a draft recap: date range, total inches, notable gusts, comparisons.
- Publish only after a human edit (I always do this; it keeps the tone credible and avoids mistakes).
If you publish consistently, you build topical authority around local weather impacts—useful for SEO, and genuinely helpful for readers.
A quick note about “Instruction Following in ChatGPT Images 2.0”
The source material you gave me also referenced an OpenAI post about Instruction Following in ChatGPT Images 2.0, credited to @jianfw. I can’t verify the content of that specific image or demonstration from inside this chat, so I won’t pretend I’ve “seen” what it shows.
I can say why this matters to a marketing team: improved instruction-following for image generation usually means you can brief visuals with tighter constraints—brand colours, layout requirements, specific objects, text placement rules—and get fewer unusable drafts. If you want, I can write a separate, fully SEO-focused article about how to use instruction-led image generation in make.com/n8n workflows for ads and landing pages, but I’ll need either the image itself or a faithful description of what’s in it.
My interpretation: what 2025–2026 suggests about local variability
From these notes, I see a few themes that keep repeating:
- Storms arrive in clusters. February 2026 shows how quickly totals add up when systems line up back-to-back.
- Forecast “misses” often come from geography. A county-wide number can’t capture whether your neighbourhood catches the heavier band.
- Inland and higher elevations tend to win during multi-storm sequences (Julian stands out in the numbers I cited).
- Small rains still matter. A 0.08-inch day won’t make the news, but it changes irrigation needs and fire-season fuel moisture in a subtle way.
When I look back over the entries, I don’t see chaos. I see a set of repeating behaviours—just with different dates and slightly different “who got hit harder” outcomes.
If you want to build your own local rain tracker (a simple plan)
You don’t need a meteorology degree. You need consistency.
Step-by-step
- Pick a location for the gauge that avoids roof runoff and sprinklers.
- Record at the same time each day during storm weeks (and after notable bursts).
- Note wind, fog, and “banding” impressions (briefly—two lines is enough).
- Compare with nearby NWS location totals to understand your bias (wetter/drier than coast, etc.).
- Keep the log in a spreadsheet so you can chart month-to-month changes.
I started doing this out of curiosity. Now I use it as a personal reference point whenever someone tells me “El Niño is coming” or “it never rains anymore.” Maybe they’re right in the grand scheme—but my little tube of water tells me what happened here.
Suggested metadata (for SEO implementation)
Meta title: San Diego Rain Patterns 2025-2026 (Elfin Forest Rain Gauge Notes)
Meta description: Detailed rain gauge notes from Elfin Forest, San Diego County, with storm totals from late 2025 to early 2026, wind observations, and comparisons to nearby NWS-reported areas like Oceanside, Carlsbad, and Julian.
Optional internal links (if you publish this on a business site)
- Services: marketing automation with make.com
- Services: workflow automation with n8n
- Case study: lead follow-up automation for local services
- Blog: how to segment geo-based email campaigns
If you tell me what your site already has, I’ll draft these as natural anchor texts that don’t read like a robot wrote them at 2 a.m.
Source attribution
- Personal rain gauge notes from Elfin Forest (as provided in your source text)
- Publicly available National Weather Service reporting referenced for nearby locations (as mentioned in the notes)
- Referenced social post: OpenAI on X (April 21, 2026) citing “Instruction Following in ChatGPT Images 2.0” demonstrated by @jianfw (unable to verify the image content directly here)