
Rainy Months in San Diego Reveal Surprising Weather Patterns
If you told me a few years ago that I’d spend my morning coffee scrolling through local rain logs from San Diego County, I’d have laughed and gone back to pretending Southern California runs on endless sunshine. Yet here we are. And if you live, work, or market to people in the region, you’ve probably noticed it too: the “always bright” stereotype starts to wobble once you look at the numbers.
This article walks you through a set of rainfall notes from an inland-coastal pocket of San Diego County near a place commonly known as Elfin Forest (between Encinitas and Escondido). The records come from a personal weather station log shared by a local resident, with day-by-day event notes across late 2025 and early 2026, plus a few snapshots from 2025. I’ll connect those observations to what they mean in practice—especially if you’re a business owner, a marketer, or someone trying to plan content, campaigns, and operations without getting caught out by “surprise” weather.
Also, I’ll keep it real: weather is messy. Two neighbourhoods can look like two different planets on the same day. So I treat this as a local story with wider lessons, not a universal verdict on all of San Diego.
Why these rainy months caught people off guard
San Diego’s brand is sunshine, beaches, and that smug little “72 degrees again” grin. You expect a dry winter with a handful of brief storms, then back to clear skies. The notes from this station suggest something more uneven: bursts of heavy rain, noticeable wind events, and lingering showery stretches that add up.
What surprised me most wasn’t a single dramatic day. It was the pattern: long quiet gaps punctuated by multi-day systems, with totals that stack up faster than you’d guess from a quick glance at the sky.
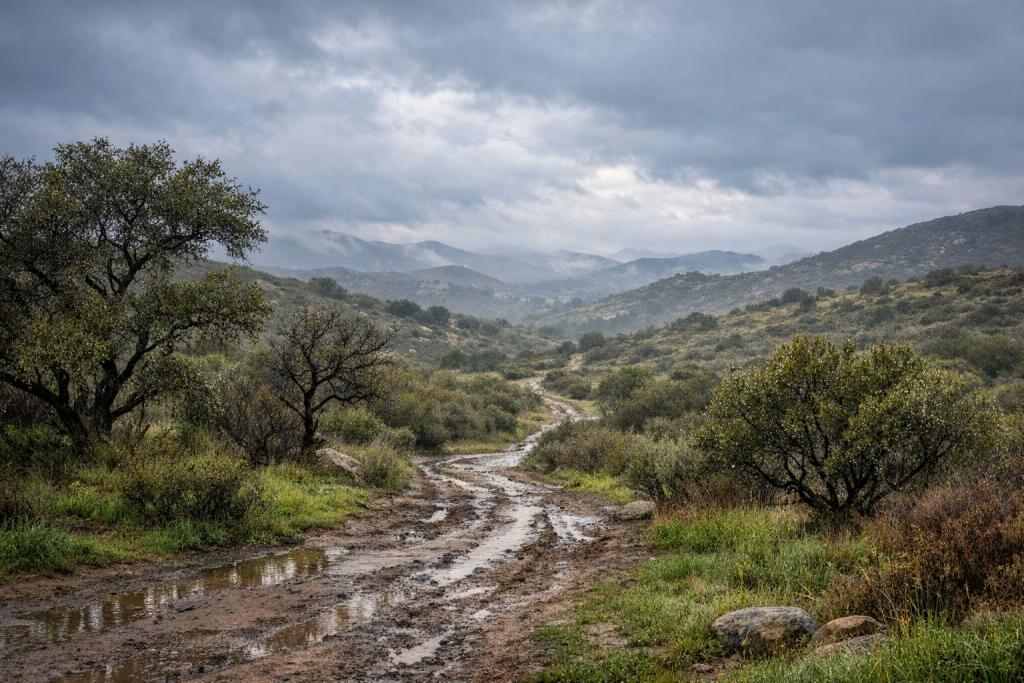
Microclimates: the “same city, different weather” problem
If you’ve lived in San Diego County for any length of time, you’ve felt the microclimates in your bones. Coastal marine layer vs. inland heat. Canyon breezes. Hills that squeeze out extra rainfall. Even small elevation changes matter. The station referenced here sits around the mid-hundreds of feet above sea level (the source notes mention 777 ft), which can shape how storms behave compared to the immediate coast.
For you, this matters because forecasts and general “San Diego weather” headlines can be true in the broad sense and still fail you locally. I’ve learned to treat any county-level statement as an opener, then check hyperlocal data before I plan anything that depends on conditions.
January 2026: a wet start, then a long pause
The log for January 2026 reads like a stop-start soundtrack: a cluster of rainy days right at the beginning of the month, then long stretches of calm, then light revisits later.
Early January: drizzle, showers, and a heavier push
According to the notes:
- January 1: light showers and drizzle added about 0.07 inches; storm total referenced around 1.87 inches.
- January 2: fog and light rain added about 0.05 inches.
- January 3: more light rainfall, about 0.05 inches.
- January 4: about 0.20 inches through afternoon/night light rain; later notes mention a heavier burst (~0.10) and an overnight addition (~0.49), putting a two-day total around 0.59 inches.
- January 5: the night stayed showery, with improving breaks later.
These aren’t Hollywood flood scenes. They’re the kind of days that quietly change soil conditions, commute traffic, and outdoor plans. If you’re in operations—say you run a field sales team, home services, or events—these “small” totals still affect punctuality, cancellation rates, and customer mood.
Late January: the weather taps you on the shoulder again
After a lull, the log shows rain returning around January 24 with a small increment (~0.05 inches over a couple of days). That sounds trivial, but it’s telling: the month didn’t simply “end dry.” It flickered.
In my experience, flickering weather creates planning friction. People don’t adjust for it because it doesn’t feel like a “real storm” until it is. That’s where businesses get caught off guard—especially if you base decisions on vibes rather than data.
February 2026: three storms in a row bring wind and meaningful totals
February is where the story gets properly punchy. The notes describe a sequence of three storms with wind, stronger rainfall periods, and regional contrasts (including heavier totals in nearby higher-elevation communities).
Early February: the smallest hint before the run
- February 6: a minimal evening trace of rain appears in the notes.
This is often how it goes: a little teaser that doesn’t change your plans, followed by a system that absolutely does.
Storm sequence: February 16, 18, and 20
The source notes describe:
- February 16: light rain from late morning, intensifying after 2 pm; wind gusts around 46 mph are mentioned.
- February 18: a windier night with heavier rain; gusts around 54 mph; rainfall for that storm day is noted around 0.44 inches, with a combined multi-storm figure around 1.89 inches at that point.
- February 20: a third storm adding about 0.59 inches; three-storm total described around 2.48 inches; wind gusts around 36 mph are also noted.
For a local rain gauge record, those totals add up to a meaningful, operationally relevant event. The wind details matter, too: strong gusts don’t just “make it unpleasant.” They knock down branches, push debris into roads, and increase the odds of power hiccups in some neighbourhoods.
Regional contrast: heavier totals in nearby inland and mountain areas
The notes also mention larger totals reported in places further inland and at higher elevations (for example, communities such as Julian and Ramona are referenced), plus substantial mountain snowfall in the broader region during that period.
I’m careful here: I’m not treating those figures as a precise regional summary, because they appear as contextual references in a personal log rather than a full dataset. Still, the takeaway is reliable: San Diego County behaves like several weather worlds stitched together. The coast can look “fine-ish” while inland areas deal with harder rain and gusts, and mountain zones can pick up heavy snow in the same system.
If you market across the whole county, segment your messaging. A single “Hey San Diego!” creative can miss the mark if half your audience is dealing with wind and road issues while the other half is just annoyed by drizzle.
Late 2025: pre-holiday storms that reset expectations
The last quarter of 2025 in these notes reads like a reminder that winter can start with a bang. November shows multiple storms, and late December adds another pair of rain events close to the holidays.
November 2025: three storms with notable rain
The log describes three storms around mid-to-late November:
- November 15: heavy rain in the afternoon with totals mentioned around 1.38 inches, then drizzle; a morning total around 1.54 inches is referenced.
- November 18: around 0.66 inches overnight, then 0.73 inches (the phrasing suggests successive additions as the system moved through).
- November 20: a third storm begins with around 0.12 inches and reaches a total around 0.46 inches.
That’s not “a sprinkling.” That’s the kind of month that makes hills greener, exposes weak guttering, and triggers the annual scramble for sandbags in the places that always scramble for sandbags.
December 2025: storms just before and after Christmas
- December 24: rain from the afternoon with heavier bursts; storm total noted around 0.65 inches, and the wider region is described as receiving much higher totals in some spots.
- December 27: about 0.29 inches with light rain and stronger showers.
Holiday timing adds a special twist: staffing is thinner, road travel goes up, and customer patience tends to go down. If you run ecommerce, local delivery, or appointment-based services, you’ll feel it.
Earlier 2025: spring and late-summer storms show the wider rhythm
The notes also include a few 2025 datapoints outside winter, and they help paint San Diego weather as less predictable than its reputation.
March 2025: storms that add up quickly
- March 7: a storm described as more of a compact radar “blob” than a classic front; total referenced around 1.53 inches.
- March 11–12: a weaker front with roughly 0.44–0.46 inches noted.
I like this detail because it reflects how people actually experience rain here: not always as sweeping, movie-style fronts, but sometimes as concentrated systems that park briefly and then move on.
April 2025: small showers still matter
- April 26: about 0.08 inches from overnight and afternoon showers.
That’s small, sure. But it’s also the type of rainfall that can muck up a photo shoot, soften a dirt trail, or throw off a weekend event plan. If you schedule content production outdoors, these tiny totals can still cost time and money.
September 2025: a hint of convective action inland
- September 3: thunderstorms inland are mentioned, with small totals referenced in nearby communities.
Late-summer storms—especially inland—tend to be hyperlocal. One area gets a proper downpour, another stays dusty. If you serve inland clients, keep a modest weather watch even when the coast looks “normal.”
What these patterns mean if you live or run a business in San Diego County
The practical impacts aren’t limited to umbrellas and soggy trainers. These patterns can influence traffic, lead flow, cancellations, and even how people respond to your ads.
1) Operations: appointments, field work, and delivery schedules
When storms cluster (like February 2026 in the notes), you can expect:
- Higher late-arrival rates for appointments
- More last-minute reschedules (especially for outdoor work)
- Slower delivery windows and more “where is my order?” tickets
- Increased safety constraints for field teams when wind picks up
My rule of thumb: treat multi-day storms as a capacity planning issue, not a minor inconvenience. You can pad schedules, pre-emptively confirm appointments, and set expectations early, which reduces support pressure.
2) Sales and marketing: weather shifts attention and intent
Rain changes behaviour. People stay in, scroll more, and often switch from “browsing” to “solve a problem.” If you sell home services, car care, insurance, property maintenance, or even simple retail basics, you can see demand spikes.
But your creative has to match reality. If it’s blowing 50+ mph in inland neighbourhoods, a sunny beach image can feel tone-deaf. I’ve seen campaigns perform better just by swapping visuals and copy to suit the week’s conditions.
- Use weather-aware copy: “Storm week booking” messaging can feel timely.
- Adjust offers: promote inspections, clean-ups, or weather-proofing services.
- Update landing pages: add short banners about scheduling and safety.
3) Content: local weather stories bring steady organic traffic
Local weather content tends to rank well because people search for:
- “How much rain did we get in…”
- “San Diego rainfall 2026”
- “Elfin Forest rain totals” (or nearby community equivalents)
- “When does it rain in San Diego”
If you publish locally relevant updates with honest numbers and clear attribution (for example, “a local station log” versus “official totals”), you can draw consistent traffic—especially during active storm periods.
How I’d turn local rainfall logs into a repeatable marketing system (with AI + automation)
I work with teams that use AI and automation to take messy, real-world inputs—like weather notes—and turn them into usable assets. You don’t need a giant newsroom. You need a simple pipeline that keeps you accurate, timely, and consistent.
Step 1: Collect inputs responsibly
Start with sources you can cite and explain. In this case, the core source is a personal weather station log shared publicly, plus broader contextual references. You can also cross-check with official meteorological agencies for bigger-picture confirmation (especially if you plan to publish exact totals as “official”).
- Label personal logs as local observations
- Keep dates, totals, and location context together
- Store raw notes so you can audit later
Step 2: Summarise and standardise with AI (without making things up)
When I use AI for this, I keep two rules:
- I ask it to summarise only what’s in the log, then separate any broader interpretation.
- I require it to keep uncertainty visible: “reported,” “noted,” “referenced,” rather than stating everything as fact.
This keeps you honest and protects your credibility. People forgive weather being volatile. They don’t forgive being misled.
Step 3: Automate content refreshes with Make or n8n
If you run campaigns tied to local conditions, automate the boring bits:
- Fetch new log entries from a feed or a document
- Update a spreadsheet with date, rainfall, and notes
- Generate a weekly digest draft for review
- Push alerts to Slack/email when totals cross a threshold (e.g., “> 0.5 inches in 24h”)
I’ve built flows where a team gets a neat weekly summary ready for editing before Monday morning. It saves time and cuts the “we meant to post, but…” problem.
A quick detour: visuals in multiple languages are getting easier
There’s an interesting parallel here. OpenAI recently highlighted that ChatGPT Images 2.0 can generate images containing non-English text with better rendering and more coherent phrasing. That matters if you create weather-related visuals, safety notices, or community updates for multilingual audiences.
In San Diego County, multilingual communication isn’t a nice-to-have. It’s practical. When conditions shift quickly, clarity matters more than cleverness.
How you can use multilingual visuals without looking sloppy
- Create storm-week announcements in the languages your customers actually use
- Match phrasing to local norms (direct, clear, no weird machine-sounding phrasing)
- Keep typography readable on mobile (most people will see it on a phone, in a hurry)
My advice: draft the text with a fluent human review, then generate the visual. If you skip the review, you risk awkward phrasing—even if the letters look perfect.
San Diego rainfall: what you can reasonably conclude from this log
Based on the station notes provided, a few conclusions hold up without overreaching:
- Late 2025 and early 2026 included multiple storm sequences with meaningful rainfall totals in this specific area.
- Rain arrived in clusters, not as a smooth, predictable pattern.
- Wind events accompanied some storms, which raises real-world impact beyond the rainfall totals.
- Nearby inland and elevated communities can receive higher totals during the same systems, reinforcing the county’s microclimate behaviour.
If you want to go further—comparing year-over-year averages, ranking wettest months, or validating totals against official gauges—you’ll need a broader dataset. I’m not going to pretend a single station settles the whole argument. Still, one station can absolutely reveal the on-the-ground experience that people remember.
Practical tips you can use this week
If you’re reading this while planning work, marketing, or content around San Diego County, these actions pay off quickly.
For local businesses
- Update your comms templates: keep short SMS/email scripts ready for storm delays.
- Build a “rain week” offer: inspections, clean-ups, weather-proofing add-ons.
- Schedule around clusters: storms often come in sets; plan for a few disrupted days, not just one.
For marketers and content teams
- Publish timely local explainers: “What we saw this week” performs better than generic climate pieces.
- Swap creatives by area: coastal vs inland messaging can differ without much extra work.
- Use real numbers carefully: attribute them as local observations unless verified as official totals.
For anyone managing teams on the ground
- Watch wind, not just rain: gusty systems create safety issues.
- Expect uneven impacts: one route can be fine while another slows to a crawl.
- Document disruptions: simple records help you plan better next season.
SEO notes: keywords and search intent this article targets
I’m including this section because you may want to reuse the structure for your own blog. The main search intents here tend to be informational and local:
- San Diego rainy months
- San Diego rainfall 2025
- San Diego rainfall 2026
- Elfin Forest rain (as a locally used place name)
- San Diego County microclimates
- rain totals San Diego County
If you want to compete for these terms, publish during storm season, update posts as new events happen, and keep your formatting clean. People skim when they’re wet, late, and mildly irritated—so give them headings, short paragraphs, and numbers that stand out.
My final take: sunshine is real, but so is the rain
I still love the San Diego mythos. It exists for a reason. But the station notes from late 2025 into early 2026 show a more nuanced reality: rain arrives in bursts, wind can come along for the ride, and conditions vary sharply by location.
If you plan your business, content, or campaigns as if the weather is always a postcard, you’ll keep getting surprised. If you treat weather like a local input—measured, logged, and translated into practical decisions—you’ll handle these swings with far less stress.
And honestly, there’s something oddly calming about it. A clear log, a few sensible adjustments, and you’re no longer guessing. You’re simply paying attention.