
San Diego Winter 2026 Rainfall Patterns and Storm Impact
If you live in San Diego long enough, you start treating rain the way Brits treat sunshine: you notice it, you talk about it, and you’re slightly suspicious it won’t last. I’ve kept a close eye on winter 2026 because it didn’t behave like the usual “a bit of drizzle, then back to beige hills” routine. Instead, we saw clustered storms, sharp wind events, and those familiar microclimate differences where inland valleys and higher elevations collect a very different story than the coast.
This article brings together a practical, numbers-first narrative of what happened across San Diego County through late 2025 and winter 2026, drawn from publicly shared day-by-day rain notes and comparisons to National Weather Service (NWS) spot reports. I’ll also add what I’ve learned from tracking these patterns over time, so you can connect the dots for your own planning—whether you commute, manage property, work outdoors, or you’re simply tired of getting caught out without a jacket.
Why Winter 2026 Stood Out in San Diego
San Diego doesn’t typically “do” long, steady wet seasons. More often, we get rain in bursts: a front rolls through, the wind has its say, the gutters overflow for a few hours, and by the next afternoon you’re back to dry streets and blue skies. Winter 2026 leaned into that pattern—but with a twist.
Two things made this period feel different:
- Storm clustering: multiple events arrived close together, especially in February 2026, where three storms hit in quick succession.
- Wind-driven fronts: several entries note gusts pushing into the 40–50+ mph range in exposed locations, which changes how rain falls, where it pools, and what damage it can cause.
From my side, the most useful takeaway is simple: when storms arrive in a cluster, soil saturation rises fast. Even if each individual event looks “modest” on paper, the combined effect shows up in runoff, hillside stability, road debris, and how quickly the landscape flips from dusty to green.
How to Read San Diego Rain Data Without Fooling Yourself
If you’ve ever compared rainfall totals with a friend across town and thought, “Are we even in the same county?”, you’re not imagining it. San Diego County rainfall varies sharply with elevation and distance from the coast. Coastal totals can look mild while foothills and mountain towns pick up substantially more.
Microclimates: Coast vs. Inland vs. Mountains
A recurring theme in the observations is that higher-elevation zones (and anything near the mountains) can act like a sponge. Places such as Julian often show higher totals during the same storm window, partly because terrain forces moist air upward where it cools and drops more precipitation.
When you interpret rainfall notes:
- Coastal stations often understate the countywide impact because they miss what falls upslope.
- Inland valleys can swing wildly depending on storm track and wind direction.
- Mountains and foothills frequently overperform compared to the coast during cold fronts.
Why Wind Matters More Than People Admit
Wind changes the hazard profile. A breezy, steady rain is one thing. A gusty frontal passage is another. In the notes for February 2026, gusts were recorded up to the mid-50 mph range during one storm. That matters because:
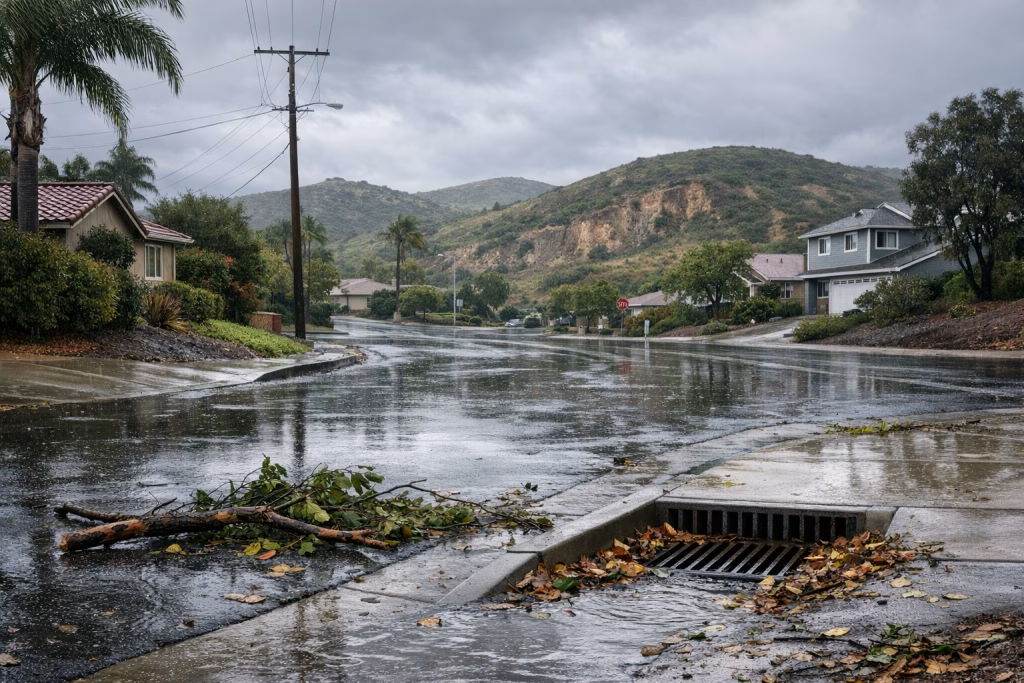
- Strong gusts push tree limbs down onto power lines.
- Wind-driven rain finds its way under roof edges and flashing.
- Blowing debris clogs storm drains, which turns “normal rain” into street flooding.
I’ve learned (the hard way) that the “wind plus rain” combo is when you want your phone charged, your outdoor items tied down, and your commute plan simplified.
February 2026: Three Storms That Tested Dry Ground
February 2026 delivered the most concentrated action of the season in the material we’re using. Three storms arrived in the second half of the month, and totals added up quickly.
Storm 1 (Around 16 February): The Start of the Sequence
The first storm in the February series ramped up after a lighter start. Notes describe rain beginning lightly late morning, then intensifying in the afternoon alongside strong winds—gusts reported in the mid-40 mph range during the more active period.
That pattern—light early, heavier later—fits a front that strengthens as the main band arrives. If you live near canyon opens or exposed ridgelines, you’ll know the feeling: the wind shifts, the trees start tossing about, and then the heavier rain turns up.
Storm 2 (17–18 February): Wind Takes the Lead
The second storm came in windy. Notes mention gusts escalating through the night into the early hours, including readings in the mid-40s and even into the 50+ mph range.
Rainfall totals listed for this event in the local gauge notes came in under half an inch for that specific station, but remember: the hazard here wasn’t just rain depth. It was timing (overnight), wind strength, and cumulative impacts from the first storm.
If you had bins out, patio umbrellas loose, or a tree that “usually behaves,” this was the type of night that exposed weak points.
Storm 3 (19 February): The Last Push, Still Meaningful Totals
The third storm is described as the final one in the cluster, passing through on 19 February, with a wind peak noted around the time the front moved through. The recorded rainfall at the referenced station for this storm was a little over half an inch, and the total for all three February storms at that location was reported as roughly 2.48 inches.
For many San Diego neighbourhoods, that’s a consequential amount—especially when it arrives close together. A couple of inches over a month might feel modest in wetter climates, but here it can mean:
- Short-term greening of hillsides and open spaces.
- Higher creek flows and quick runoff in urban channels.
- More visible pothole growth (our roads, bless them, do not love water).
NWS Spot Totals: A Snapshot Across the County
The notes include a set of NWS-reported spot amounts for the morning following the last February storm. These figures show how totals can vary across the region. Reported values (in inches) included approximately:
- Oceanside: 0.36
- Carlsbad: 0.45
- San Marcos: 0.40
- Escondido: 0.44
- Rancho Bernardo: 0.40
- Poway: 0.57
- San Diego (city): 0.41
- La Mesa: 0.59
- Ramona: 0.40
- Julian: 0.95
Even in that small list, you can see the elevation effect nudging totals up toward the mountains.
January 2026: “In Pieces,” But Adding Up
January 2026 reads like a month of scattered events rather than one dominant storm cycle. I often find those months sneak up on people. You get a wet morning here, a bit of drizzle there, and suddenly your monthly total looks more serious than your memory suggests.
Early January: Multiple Days of Light-to-Moderate Rain
The notes describe a sequence around the 2nd through 5th of January, including drizzle and lighter showers, then a heavier early-morning period around the 5th with close to half an inch recorded for that day at the station referenced.
What I take from this is practical: in San Diego, light, repeated rain can be more disruptive than one single flashy downpour. It saturates soil gradually, encourages mould in poorly ventilated spaces, and keeps trails sloppy for longer than you’d expect.
Late January: Minimal Additions
Later in the month, another short period is described with very small totals—almost a rounding error on paper, but still part of the overall pattern of stop-start precipitation.
In my experience, very small events can still matter if you’re dealing with:
- Dust suppression on construction sites
- Allergy swings (yes, even in winter)
- Gardening schedules and soil timing
December 2025: A Rainy Holiday Cameo
Late December 2025 included a notable holiday-period storm. The notes mention a Christmas Eve event with a station total recorded around 0.65 inches. There’s also reference to far heavier amounts in other parts of Southern California and in the mountains, including very large totals and significant snow in higher elevations.
That checks out with how regional winter systems behave: the same broad storm can look “medium” at the coast and intense elsewhere. If your family drove over mountain routes for the holidays, you probably felt the difference pretty quickly.
27 December: Light Follow-Up Rain
A few days later, additional light rain was recorded (under a third of an inch at the referenced station). These post-storm “afterthought” events are common. They don’t grab headlines, but they keep the ground damp and can extend the period where minor slope issues and pooling remain in play.
November 2025: A Busier Start to the Wet Season
November appears as a more active month, with a sequence of storms and an especially heavy event mid-month in the notes. If you’re trying to understand how winter 2026 set up, looking back at November helps: early wet-season storms can prime the landscape, then later winter systems either build on that moisture or arrive after a dry reset.
Mid-November: Heavier Rain Episodes
The notes describe a storm around 15–16 November with rainfall building notably through the day and into the next morning, reaching totals that were much higher than the later “small” events. The pattern described—heavier bands, then continued accumulation—matches the kind of system that can briefly overwhelm drainage in older neighbourhoods.
If you noticed standing water at intersections around that time, you weren’t alone. San Diego drainage varies street by street. Some areas shed water quickly; others keep it like a souvenir.
18–20 November: Another Round
Another storm window around 18 November is described with totals around three-quarters of an inch at the referenced station. A smaller additional event is also mentioned around 20 November.
From a planning perspective, this is the “keep your guard up” part of the season: multiple events close together, with totals that start to matter for waterlogged yards and hillside trails.
23 November: A Small Third Storm
A third storm is described as adding only a small amount, bringing the three-storm sequence total (for that set in the notes) to under half an inch for that specific portion. It’s a good reminder that forecasts and outcomes can diverge, especially along the coast where storm tracks can wobble.
Earlier Context: Spring 2025 and Late Summer 2025 Notes
The material also references earlier, more scattered precipitation events: light February 2025 rain, a March 2025 event described as a “blob” pattern, and a September 2025 thunderstorm-like setup more focused inland.
These details matter because San Diego precipitation isn’t only about winter. Late summer and early autumn can throw convective surprises—often uneven, localised, and short-lived. If you’ve ever watched one neighbourhood get hammered while another stays dry, that’s the vibe.
What Those Off-Season Events Tell You
- Storm shape matters: narrow bands and local blobs can create sharp differences over small distances.
- Interior areas can spike: places farther inland can pick up quick totals even when the coast stays quiet.
- Forecasting is probabilistic: a forecast cone doesn’t guarantee your street sees the same reality as the model average.
Impact on the Ground: What Residents Actually Notice
Numbers are helpful, but impact is what you remember. When I think about winter 2026’s pattern—especially February’s storm cluster—these are the main real-world effects people tend to report.
1) Short-Term Landscape Change
Two-plus inches across a short window can turn hills green, trigger brief wildflower potential in open spaces, and reset the look of the county. It’s one of those rare times when San Diego looks almost… well, lush. Not for long, but long enough to make you consider hiking again.
2) Road and Commute Disruption
San Diego drivers don’t get much “wet practice,” and roads collect oils during dry periods. That first heavy rain after a dry spell makes surfaces slick. Combine that with wind, debris, and puddling, and you get slower travel and more minor collisions.
I tend to advise friends to treat the first hour of a strong front like you would treat a queue at Heathrow: accept it will take longer, and don’t try to outsmart it.
3) Local Flooding and Drainage Issues
Even when totals look moderate, clogged drains and fast runoff can create localised flooding. The risk increases when storms cluster, because debris accumulates and soil loses its capacity to absorb quickly.
4) Mountain Impacts: Higher Totals and Snow
The notes mention much heavier precipitation and substantial snow in higher elevations during certain regional storms. That aligns with typical Southern California winter dynamics: inland mountains can receive major snowfall while the coast gets rain—and that contrast affects travel, supply runs, and safety advisories.
San Diego Winter 2026: A Pattern Summary You Can Actually Use
Rather than memorising every daily total, you’ll get more value by keeping a few pattern-based lessons in mind. Here’s how I’d summarise this season for day-to-day decision-making.
Rain Arrived in Bursts, Not a Continuous Wet Season
If you’re planning outdoor work, events, or home maintenance, the “bursty” pattern matters. You often have dry gaps between storms, which creates short windows for:
- Clearing gutters
- Checking roof edges and downspouts
- Moving outdoor furniture back into place
- Scheduling yard drainage fixes
February’s Cluster Was the Main Story
The three-storm February sequence stood out because it compounded impacts. Even if each storm looked manageable, their combined total and timing increased practical disruption.
Elevation Differences Stayed Consistent
Coastal totals often sat below inland/mountain totals in the reported snapshots. If you live inland—or you travel to higher elevations—don’t rely on a coastal station to judge conditions.
Home and Property Prep: Simple Steps That Pay Off
I’m not a fan of panic prep. San Diego storms rarely require drama, but they do reward a bit of calm effort. Based on the wind-and-rain profile described in the notes, these are the moves I’d make (and I do, when I remember in time).
Before the Storm
- Clear gutters and downspouts so rain has somewhere to go.
- Secure loose outdoor items if gusts are forecast—bins, chairs, small tables.
- Check mature trees for dead limbs if you can do so safely (or book an arborist).
- Know your low spots: where does water pool near your driveway or street?
During the Storm
- Avoid flooded crosswalk corners and fast-moving gutter water—urban runoff can be deceptively strong.
- Drive gently in the first hour of heavy rainfall after dry days.
- Watch wind timing: the strongest gusts often arrive with the frontal passage.
After the Storm
- Clear storm drain grates near your home if it’s safe and allowed locally.
- Check for roof or fence damage while it’s still fresh.
- Give slopes time: saturated hillsides can remain unstable even when skies clear.
SEO Notes: How People Search This Topic (and How You Can, Too)
If you’re trying to follow storms like a local, your search terms matter. I’ve found that swapping generic searches for location-specific phrasing gives you better, faster sources.
Common useful search phrases include:
- San Diego rainfall totals February 2026
- San Diego winter storms 2026
- NWS rainfall reports San Diego County
- Julian CA rainfall totals
- Poway rainfall storm total
- San Diego wind gusts storm
If you want to mirror how meteorologists think, add terms like “storm total” or “frontal passage”, and include your specific city or neighbourhood.
A Quick Note on the Source Material and Verification
The rainfall narrative here relies on a set of publicly shared station notes and NWS spot comparisons included in the provided material. I haven’t independently verified every station setup, sensor calibration, or location detail beyond what was shared there, so treat the gauge totals as useful observational data rather than a formal climatology report.
For official records, I recommend checking NWS products and established climate datasets. In ordinary life, though, these local notes are often the most relatable way to understand what actually happened street by street.
Closing Thoughts: What Winter 2026 Suggests for Future Seasons
San Diego’s weather has a habit of keeping you humble. One year you water the garden like it’s a part-time job; another year you’re mopping a garage corner you forgot could leak. From the winter 2026 pattern described here, I’d keep three expectations in your back pocket:
- Storm clusters can arrive fast, especially mid-winter, and their combined effect matters.
- Wind often defines the damage more than rainfall totals alone.
- Elevation drives big differences, so county-wide “averages” won’t match your street.
If you live here, you already know the local truth: rain is rarely constant, but when it shows up, it makes a point. I’d plan for bursts, respect the wind, and keep one decent jacket somewhere you won’t forget it—ideally not buried under beach towels.